John Grigg
Senior Lecturer
Department of Ophthalmology, University of Sydney
[email protected]
The objectives of the visual field exercises are to:
- Identify which components of the retina are represented in which parts of the visual field.
- Recognise the relationship of the anatomy of the nerve fibre layer to visual field defects.
- Become familiar with automated visual field printouts.
- Recognise the spectrum of visual field defects in glaucoma.
- Recognise a range of visual field defects and their possible aetiology.
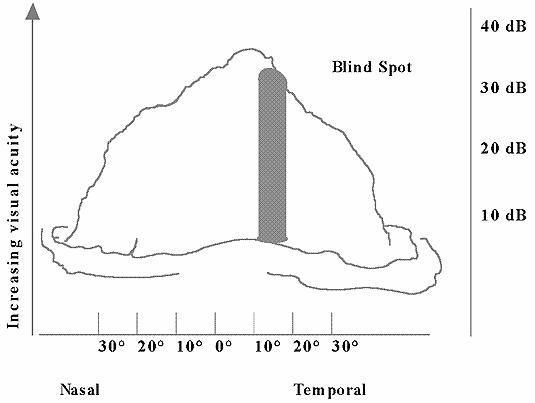
Hill of Vision
- Do you trip on things?
- Do you bump into things?
- Do you have trouble locating things?
- Do you have trouble following a line of print or finding the next line?
- Are moving things easier to see than things that are standing still?
- Do you see better on grey days or sunny days?
- Do you have trouble finding your own cloths in the cupboard or on a coat rack?
- Do you notice any variation in colour richness from time to time?
- Have you had to give up any activities because of your vision?
Methods of Measuring the Visual Field
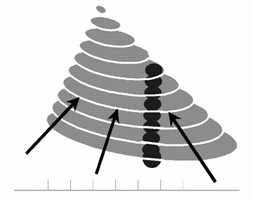
Kinetic perimetry is the basis for confrontation visual fields. The target is moved from the non-seeing to seeing to map the boundary of the visual field. This technique is operator dependent as the speed of the target influences the result.
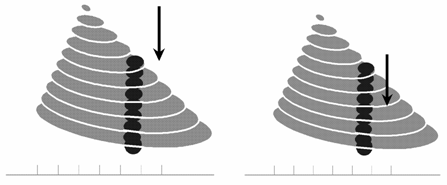
Static perimetry is the process of presenting stimuli of varying brightness but otherwise the same features to determine the boundary of seeing and not seeing. The process is subjective. This is the method used in automated perimetry such as the Humphrey analyser.
-
Full threshold
This strategy using a bracketing technique (4-2) where following presentation of an initial stimulus the next and subsequent stimuli are made 4dB brighter or dimmer until the patient either sees the stimulus or just misses the point. Then the stimuli are made 2dB brighter or dimmer until the stimulus is seen again or just not seen. The average of the last value just seen and not seen is then taken as the threshold for the location. This technique means that the boundary of the hill of vision is crossed twice.
Fastpac
The stimulus is change by 3dB amounts until the target is either just seen or not seen this figure is then recorded as the threshold value for that point.
SITA
Uses the 4-2 bracketing technique but modifies the procedure by comparing the expected response and the actual response. If the patient responds on the first occasion with an expected response then this is accpetd rather then proceed through the whole bracketing technique. If the response deviates from normal then a full bracketing technique is undertaken.
| Test | Description | Advantage | Disadvantage |
| Humphrey 30-2 | Full threshold field with radius of 300 | Determines full depth of defect | Long Time to do test, learning effect, measures central field |
| Humphrey 24-2 | Full threshold field with radius of 240 | Determines full depth of defect, commonly used for glaucoma screening and monitoring, shorter testing time | learning effect, measures central field |
| Humphrey Screening 120 Point | Measures visual field with radius of 560 | Short test, covers large component of visual field both central and peripheral | Screening so only detects absolute scotomas not partial |
| Goldmann Field | Kinetic perimetry | Full field | Requires trained tester, reliability affected by speed of target, few machines available now outside teaching hospitals and skills in performing these tests are being lost as static automated fields replacing |
| Humphrey 30-60 | Full threshold testing peripheral field from radius 30 to 600 | Measures full depth of scotoma in peripheral field | Fluctuation within and between tests makes interpretation difficult, long testing time making difficult for patient to perform and thus affecting reliability of test |
| Esterman Binocular | Tests binocular field to 800 horizontally | Functional visual field test available on Humphrey perimeter |
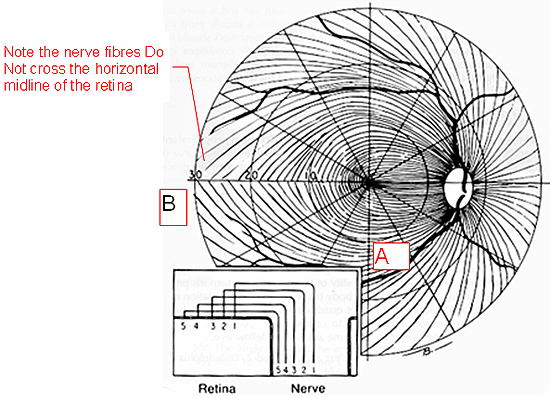
- Describe the visual field if there was a lesion obliterating the macula?
- A lesion at (A) would result in a field defect in the nasal or temporal visual field?
- A lesion at (B) would result in what type of field defect?
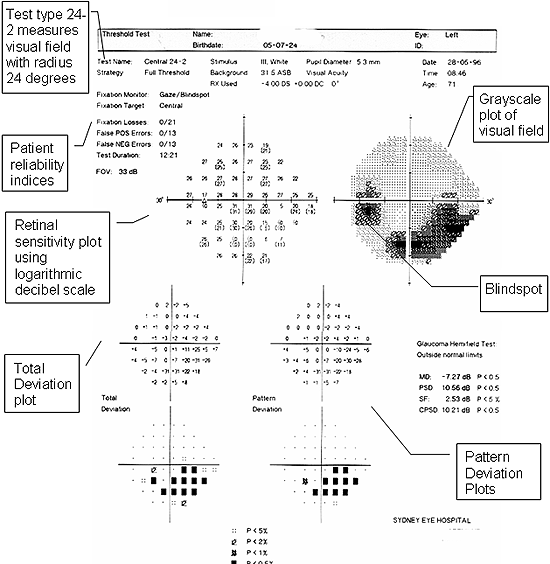
Gray scale plot
Gives a graphical presentation of the retinal sensitivity data. Black represents a scotoma.
Total Deviation Plots
Numeric values in the upper part represent the difference in decibels between the patient's test results and the age corrected normal values at each tested point in the visual field.
Pattern Deviation Plots
Humphrey analyser has adjusted the test results for any overall changes in the height of the measured hill of vision caused for example, by cataracts or small pupils. Thus the numeric pattern deviation shows the deviation in decibels from the age-corrected normal values, adjusted for any overall shift in sensitivity.
Blindspot
represents the optic nerve and projects to temporal field allowing the field to be sided
-
Humphrey perimeter has 3 main reliability indices:
- Fixation loss rate
- a. Gives an estimate of the percentage of the time the patient fails to look at the central fixation light. Determined by projecting 5% of the stimuli onto the patient's blind spot. Accept up to 33% fixation losses before declaring field unreliable. - False Positive Errors
- a. Projector setting up to project a stimulus (with accompanying mechanical noise) and then not projecting one. If patient presses button then this is recoreded as a false positive. More than 2 false positive responses or 33% whichever is the lower indicates an unreliable field. - False Negative Errors
- a. The perimeter presents suprathreshold stimuli in locations previously tested. If patient fails to respond then false negative recorded. Greater than 33% indicates an unreliable field.
-
To do this cover your left eye and then fix with your right eye on the small circle. You will need to have your right eye directly in line with the small circle and be approximately 20-30 cm from the page depending on monitor resolution. If you have positioned yourself correctly then the large circle will disappear

What conditions would cause the blindspot to be enlarged?
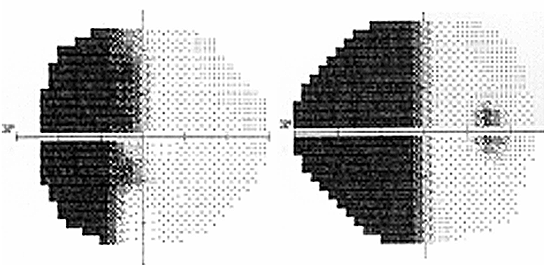
- Describe the visual field defect
- Where could the pathology be?
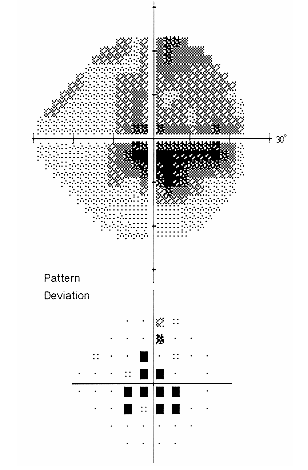
- Describe the visual field defect present in this patient
- What condition is this field defect commonly associated?
Visual Fields are viewed as if you were doing the test yourself
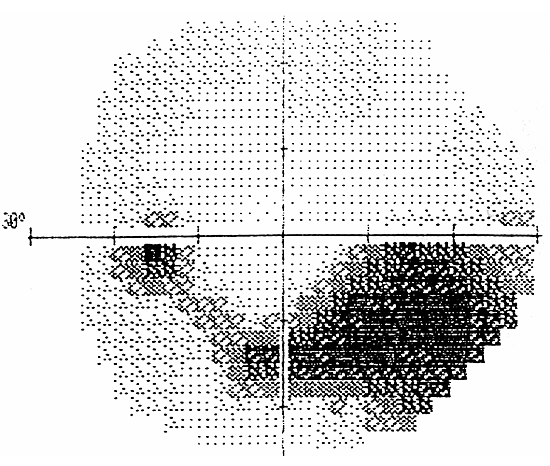
- Describe the field defect, the likely causative condition and the stage of the disease process.
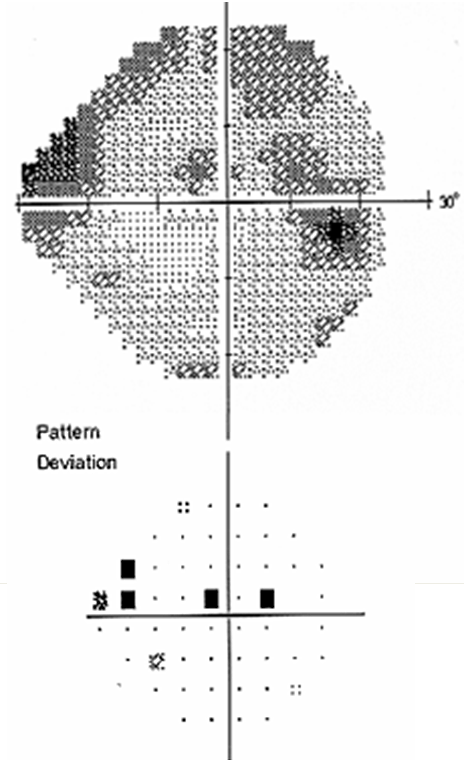
- Describe the visual field defect and the likely disease process.
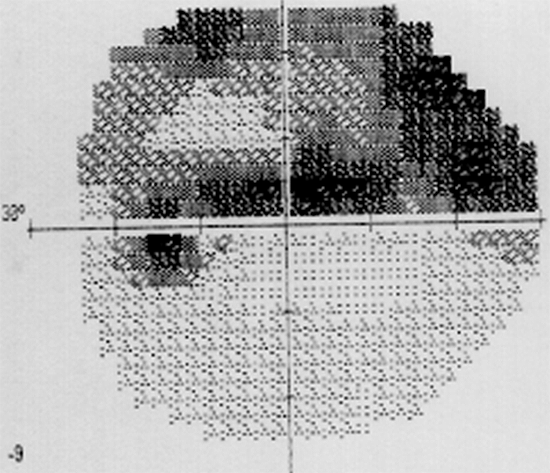
- Describe the visual field defect.
- Describe the likely pathology and the stage in the disease process.
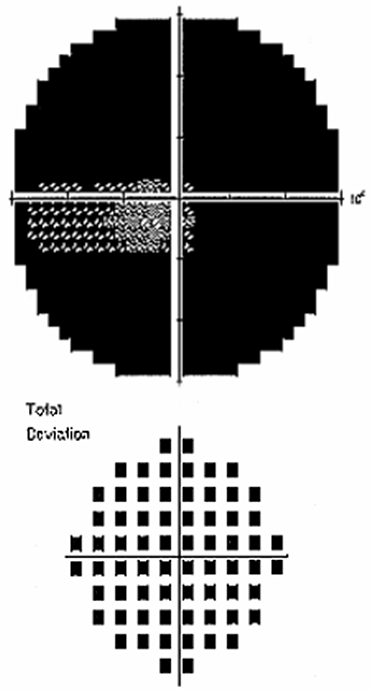
- Describe the visual field defect and the site of the lesion.
- Would this patient have any symptoms? Should this patient drive a car?
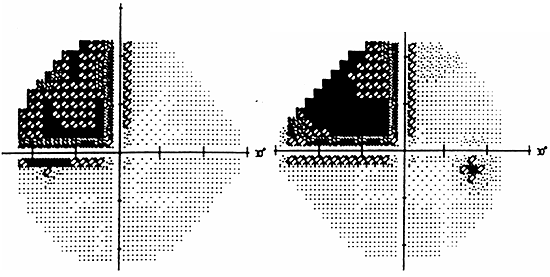
- Describe the visual field defect.
- Where is the site of the pathology.
- What is the most likely cause for this field defect.
